Documentation
How to cite PLAAC
If you use this this website, or the underlying code, in any publication, please cite our Bioinformatics paper Lancaster et al. (2014) , which also describes additional extensions and implementation details of the algorithm. Code for the algorithm, as well as for powering this website is available at GitHub under the open-source MIT license.
How to use web-based PLAAC
The user should paste sequence into the text box, or upload a FASTA file. Then the user can specify two optional parameters:
- the background amino-acid (AA) frequencies (see below)
- the minimal contiguous prion-like domain length for the hidden Markov model (HMM), the default is c = 60.
As the prion-like AA frequencies were derived from S. cerevisiae , the default option is to use background frequencies from S. cerevisiae as well (i.e., treat the per-AA likelihood-ratios are species independent); the slider in this case is set to α = 100%.
The other extreme is to use use the background frequencies of the species being scored (i.e., treat the prion-like AA frequencies as species-independent). This is done by setting the slider to α = 0%. One can also linearly interpolate between these two extremes with any value of &alpha between 0% and 100%, e.g. set the slider to α = 50% for an average of the background frequencies of S. cerevisiae and the species being scored.
The background AA frequencies for S. cerevisiae are built into the program. For any other species, PLAAC needs to know what frequencies to use. If α < 100%, the default is to compute the background AA frequencies for the input sequences and then interpolate between these with the background frequencies from S. cerevisiae (degree of interpolation given by the slider α).
However, if the input set of sequences is not an entire proteome, this may not be a good estimate of background frequencies; in particular, if the input sequences are pre-selected to consist of proteins with prion-like domains (e.g. candidates for plotting) then this is a bad idea, as the background AA frequency can be strongly skewed. To avoid this problem, instead one should upload the entire proteome and select the individual sequences to plot on the next page.
One can also paste or upload only subset of proteins but select from the precomputed set of background frequencies for several species we provide. In both cases the frequencies will still be interpolated with the S. cerevisiae background AA frequencies (unless α = 0).
Finer control over PLAAC, including the option to use customized background frequencies is available in the command-line (cli) version of PLAAC available from github: https://github.com/whitehead/PLAAC/blob/master/cli/README.md
Columns in online output, and in the downloadable summary table
The tables in the online output display four output variables: COREscore, LLR, PAPAprop and PAPAfi. Definitions of the values of these columns, along with other columns only available in the TSV summary file are described below. Note in the description below, 'c' = the core length in residues entered by the user (as noted above, this default is set to 60 AA residues).
- SEQid sequence name from fasta file
- MW Michelitsh-Weissman [PNAS 2000] score --- maximum number of N + Q in window of at most 80 AA
- MWstart index of start position of window with max MW score.
- MWend index of end position of window with max MW score
- MWlen length of window used for MW score [smaller of 80 and PROTlen].
- LLR max sum of PLAAC log-likelihood ratios (base 4) in window of size c [NaN if PROTlen < c]
- LLRstart index of start position of window with max LLR score [-1 if PROTlen < c]
- LLRend index of end position of window with max LLR score [-1 if PROTlen < c]
- LLRlen length of window used for LLR score [should be c]
- NLLR normalized LLR score, i.e. LLR/LLRlen [NaN if PROTlen < c]
- VITmaxrun maximum length of consecutive PrD state in Viterbi parse
- COREscore max sum of PLAAC LLRs in window of size c contained entirely within Viterbi parse [NaN if VITmaxrun < c]
- COREstart index of start position of window with max COREscore [-1 if VITmaxrun < c]
- COREend index of end position of window with max COREscore [-2 if VITmaxrun < c]
- CORElen length of window used for CORElen [should be either c or 0]
- PRDscore sum of PLAAC LLRs in full region of Viterbi parse containing CORE region, if any [NaN otherwise].
- PRDstart index of start position of window with PRDscore [-1 if VITmaxrun < c]
- PRDend index of end position of window with PRDscore [-2 if VITmaxrun < c]
- PRDlen length of window used for PRDscore
- PROTlen number of AAs in protein, not including terminal stop codon if any.
- HMMall log-likelihood ratio for sequence under two-state HMM vs. one-state background HMM
- HMMvit log-likelihood ratio for sequence under Viterbi parse of two-state HMM vs. one-state background HMM
- COREaa AA sequence at which COREscore is attained [- if VITmaxrun < c]
- STARTaa first 15 AA of PRDaa [- if VITmaxrun < c]
- ENDaa last 15 AA of PRDaa [- if VITmaxrun < c]
- PRDaa AA sequence at which PRDscore is attained [- if VITmaxrun < c]
- FInumaa number of AAs predicted to be disordered by FoldIndex [Prilusky et al, Bioinformatics, 2005] (exludes runs of under 5 AA)
- FImeanhydro hydropathy score <H> for entire protein [Uversky et al, Proteins, 2000]
- FImeancharge mean charge <R> for entire protein [Uversky et al, Proteins, 2000]
- FImeancombo disorder score for entire protein: 2.785<H> - |<R>| - 1.151 [Uversky et al, Proteins, 2000]
- FImaxrun length of longest run of predicted disorder by FoldIndex
- PAPAcombo signed distance to PAPA decision surface [as in King et al Brain Res 2012]
- PAPAprop maximal score of PAPA prion propensities (averges of averages) in region with negative FI score [Toombs et al MBC 2012]
- PAPAfi FI score (averages of averages) at PAPAcen
- PAPAllr PLAAC LLR score (average) at PAPAcen
- PAPAllr2 PLAAC LLR score (average of averages) at PAPAcen
- PAPAcen index of center of window at which PAPAprop is obtained
- PAPAaa AA sequence of width W centered at PAPAcen
Algorithm details
The original version of the PLAAC algorithm is described in
Alberti et al. (2009);
updated AA frequencies for the
prion-like state, and adjustments for background frequencies of
other species (with α=50%) were used in
Couthouis et al. (2011).
The default hidden Markov model (HMM) for PLAAC, which uses the updated AA frequencies for the prion-like state, and
AA frequencies from
S. cerevisiae
for the background state, is shown below; background AA frequencies may differ at runtime if α < 100% is used. For a
detailed introduction to HMMs see e.g. Chapter 3.2
of
Durbin et al. (1998).
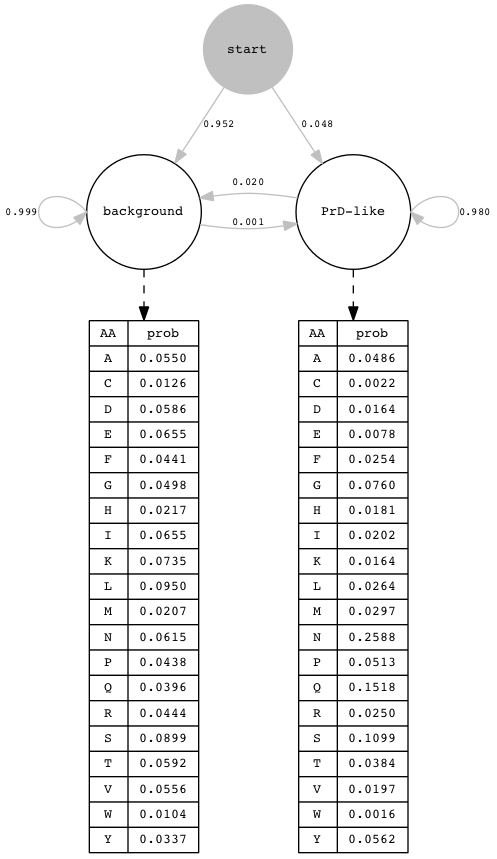
The initial probabilites for the two states are indicated here as transition probabilites from a virtual start state; these probabilites were computed as the stationary distribution of the Markov chain defined by the transition probabilites between the two hidden states. These transition probabilities between states model the intuition that regions with prion-like amino acid composition will on average be about 50 AA long, and regions with background amino acid composition will on average be about 1000 AA long, so about 5% of AAs are expected to be in regions with prion-like composition. The relatively small transition probabilites penalize switches between hidden states, so parses with very short runs in either state will not score highly, but Viterbi or MAP parses with runs of length < 50 in the prion-like state can occur; those of length less than the user-specified core length c in the Viterbi parse are filtered out in postproceessing. We do not explictly model protein length (which would be defined implictly through a transition probability to a stop state), and trim terminal stop codons from input sequences, but the algorithm assigns a small emission probability (0.00001) to '*' and also to 'X' from both hidden states, so that sequences with internal stop codons or unkown residues can be parsed and scored.
In adddition to HMM parses and profiles of per-residue posterior probabilities for each state, PLAAC produces plots of sliding averages of per-residue log-likelihood ratios for the prion-like versus background state. To illustrate that regions with prion-like composition are often predicted as disordered by FoldIndex ( Prilusky et al., 2005 ) (a sliding window version of the approach described in Uversky et al., (2000) ), these sliding averages are scaled (by using base-4 rather than natural logarithms) and reversed in sign, in a track called -PLAAC, along with a re-implementation of FoldIndex. (There are also many regions that are predicted to be disordered by FoldIndex but that do not score highly in PLAAC, as non-compensating charged residues are favorable for disorder in FoldIndex, but not favorable for PLAAC.) Plots also include a re-implementation of PAPA ( Toombs et al., 2010 ; Toombs et al., 2012 ) which is multiplied by -4 so that lower scores are more predictive of prion propensity, and so that the range is more comparable to the other tracks. A dashed green line represents a similarly rescaled version of the cutoff PAPA > 0.05. Because the cutoffs for PAPA are defined not for sliding averages, but rather for sliding averages of sliding averages, by default we show "doubly-smoothed" versions of plots, as in Toombs et al. (2012) and Kim et al. (2013) ; "singly-smoothed" versions can be produced with the command-line version of PLAAC.
When computing sliding averages centered at each residue of a protein, say for window-size w = 41, there is an issue of what to do when a portion of the window falls outside the sequence. One option is to not score such windows at all (or give them a score of NA), leading to a shortening by (w - 1)/2 = 20 positions from each end for single smoothed profiles, and another 20 from each end for doubly-smoothed profiles. Another option is to ignore just those positions that fall outside the windows when computing each average --- in the extreme cases of windows centered at terminal residues, the scores then represent the averages of (w-1)/2 + 1 = 21 residues rather than w = 41. For consistency, we use the same approach as PAPA for all three tracks. This is to use the second option for the first round of smoothing (so singly-smoothed profiles have the same length as the protein sequences, with no NA values), and a modified version of the first option for the second round of smoothing (giving NA values for the first and last (w-1)/2 positions). The modification is that rather than computing simple averages of singly-smoothed scores in the second round, a weighted average is computed, with weights proportional to the number of positions that contributed to them in the first round (ranging from (w-1)/2 + 1 up to w). Users are also welcome to ignore the first and last w residues from the doubly-smoothed profiles, which then amounts to using two applications of the unmodified first option above.
References
Alberti S, Halfmann R, King O, Kapila A, Lindquist S. (2009)
A systematic survey identifies prions and illuminates sequence features of prionogenic proteins.
Cell 137, 146-58.
Couthouis J, Hart MP, Shorter J, Dejesus-Hernandez M, Erion R, Oristano R, Liu AX, Ramos D, Jethava N, Hosangadi D, Epstein J, Chiang A, Diaz Z, Nakaya T, Ibrahim F, Kim HJ, Solski JA, Williams KL, Mojsilovic-Petrovic J, Ingre C, Boylan K, Graff-Radford NR, Dickson DW, Clay-Falcone D, Elman L, McCluskey L, Greene R, Kalb RG, Lee VM, Trojanowski JQ, Ludolph A, Robberecht W, Andersen PM, Nicholson GA, Blair IP, King OD, Bonini NM, Van Deerlin V, Rademakers R, Mourelatos Z, Gitler AD (2011)
A yeast functional screen predicts new candidate ALS disease genes.
Proc Natl Acad Sci U S A. 108(52):20881 - 20890.
Durbin R, Eddy S, Krogh A, Mitchison G. (1998)
Biological Sequence Analysis: Probabilistic Models of Proteins and Nucleic Acids
Cambridge University Press
Kim HJ, Kim NC, Wang YD, Scarborough EA, Moore J, Diaz Z, MacLea KS, Freibaum B, Li S, Molliex A, Kanagaraj AP, Carter R, Boylan KB, Wojtas AM, Rademakers R, Pinkus JL, Greenberg SA, Trojanowski JQ, Traynor BJ, Smith BN, Topp S, Gkazi AS, Miller J, Shaw CE, Kottlors M, Kirschner J, Pestronk A, Li YR, Ford AF, Gitler AD, Benatar M, King OD, Kimonis VE, Ross ED, Weihl CC, Shorter J, Taylor JP (2013).
Mutations in prion-like domains in hnRNPA2B1 and hnRNPA1 cause multisystem proteinopathy and ALS.
Nature 495(7442):467-473.
Lancaster AK, Nutter-Upham A, Lindquist S, King OD. (2014)
PLAAC: a web and command-line application to identify proteins with Prion-Like Amino Acid Composition
Bioinformatics doi:10.1093/bioinformatics/btu310
Michelitsch MD, Weissman JS. (2000)
A census of glutamine/asparagine-rich regions: implications for their conserved function and the prediction of novel prions.
Proc Natl Acad Sci USA 97(22):11910-11915.
Prilusky J, Felder C, Zeev-Ben-Mordehai T, Rydberg EH, Man O, Beckmann JS, Silman I, Sussman JL (2005)
FoldIndex: a simple tool to predict whether a given protein sequence is intrinsically unfolded.
Bioinformatics 21:3435-3438
Toombs JA, McCarty BR, Ross ED. (2010)
Compositional determinants of prion formation in yeast.
Mol Cell Biol 30:319-332.
Toombs JA, Petri M, Paul KR, Kan GY, Ben-Hur A, Ross ED (2012)
De novo design of synthetic prion domains.
Proc Natl Acad Sci USA 109:6519-6524.
Uversky VN, Gillespe JR, Fink AN (2000)
Why are 'natively unfolded' proteins unstructured under physiologic conditions?
Proteins 41:415-427.